
Remote Power Monitoring: Taking It to the Next Level
TL;DR: This article details the evolution of a home power monitoring project, transitioning from a simple ping-based system to a sophisticated setup using the EcoFlow Public API, MQTT, Prometheus, and Grafana. Key improvements include detailed power metrics, real-time monitoring, and customizable alerts. The project showcases the power of open-source tools for home automation and provides valuable insights for fellow tech enthusiasts.
Introduction
Hey fellow engineers and architects! I’m excited to share the latest developments in my home power monitoring project. If you caught my previous post, you’ll know this all started as a way to keep my family informed about power outages. Well, we’ve made some significant strides since then, and I can’t wait to walk you through the changes.
Project Overview
Since my previous post, I’ve been working on several key improvements:
- Migrating from our ping-based system to the EcoFlow Public API for more robust monitoring
- Implementing detailed tracking of power input/output from backup batteries and other key metrics
- Gaining hands-on experience with MQTT (a side goal that emerged during implementation)
Our alerting system has been holding strong for the past three months, with only one minor hiccup involving Tailscale key rotation. However, as any tech enthusiast knows, there’s always room for improvement.
The EcoFlow Public API
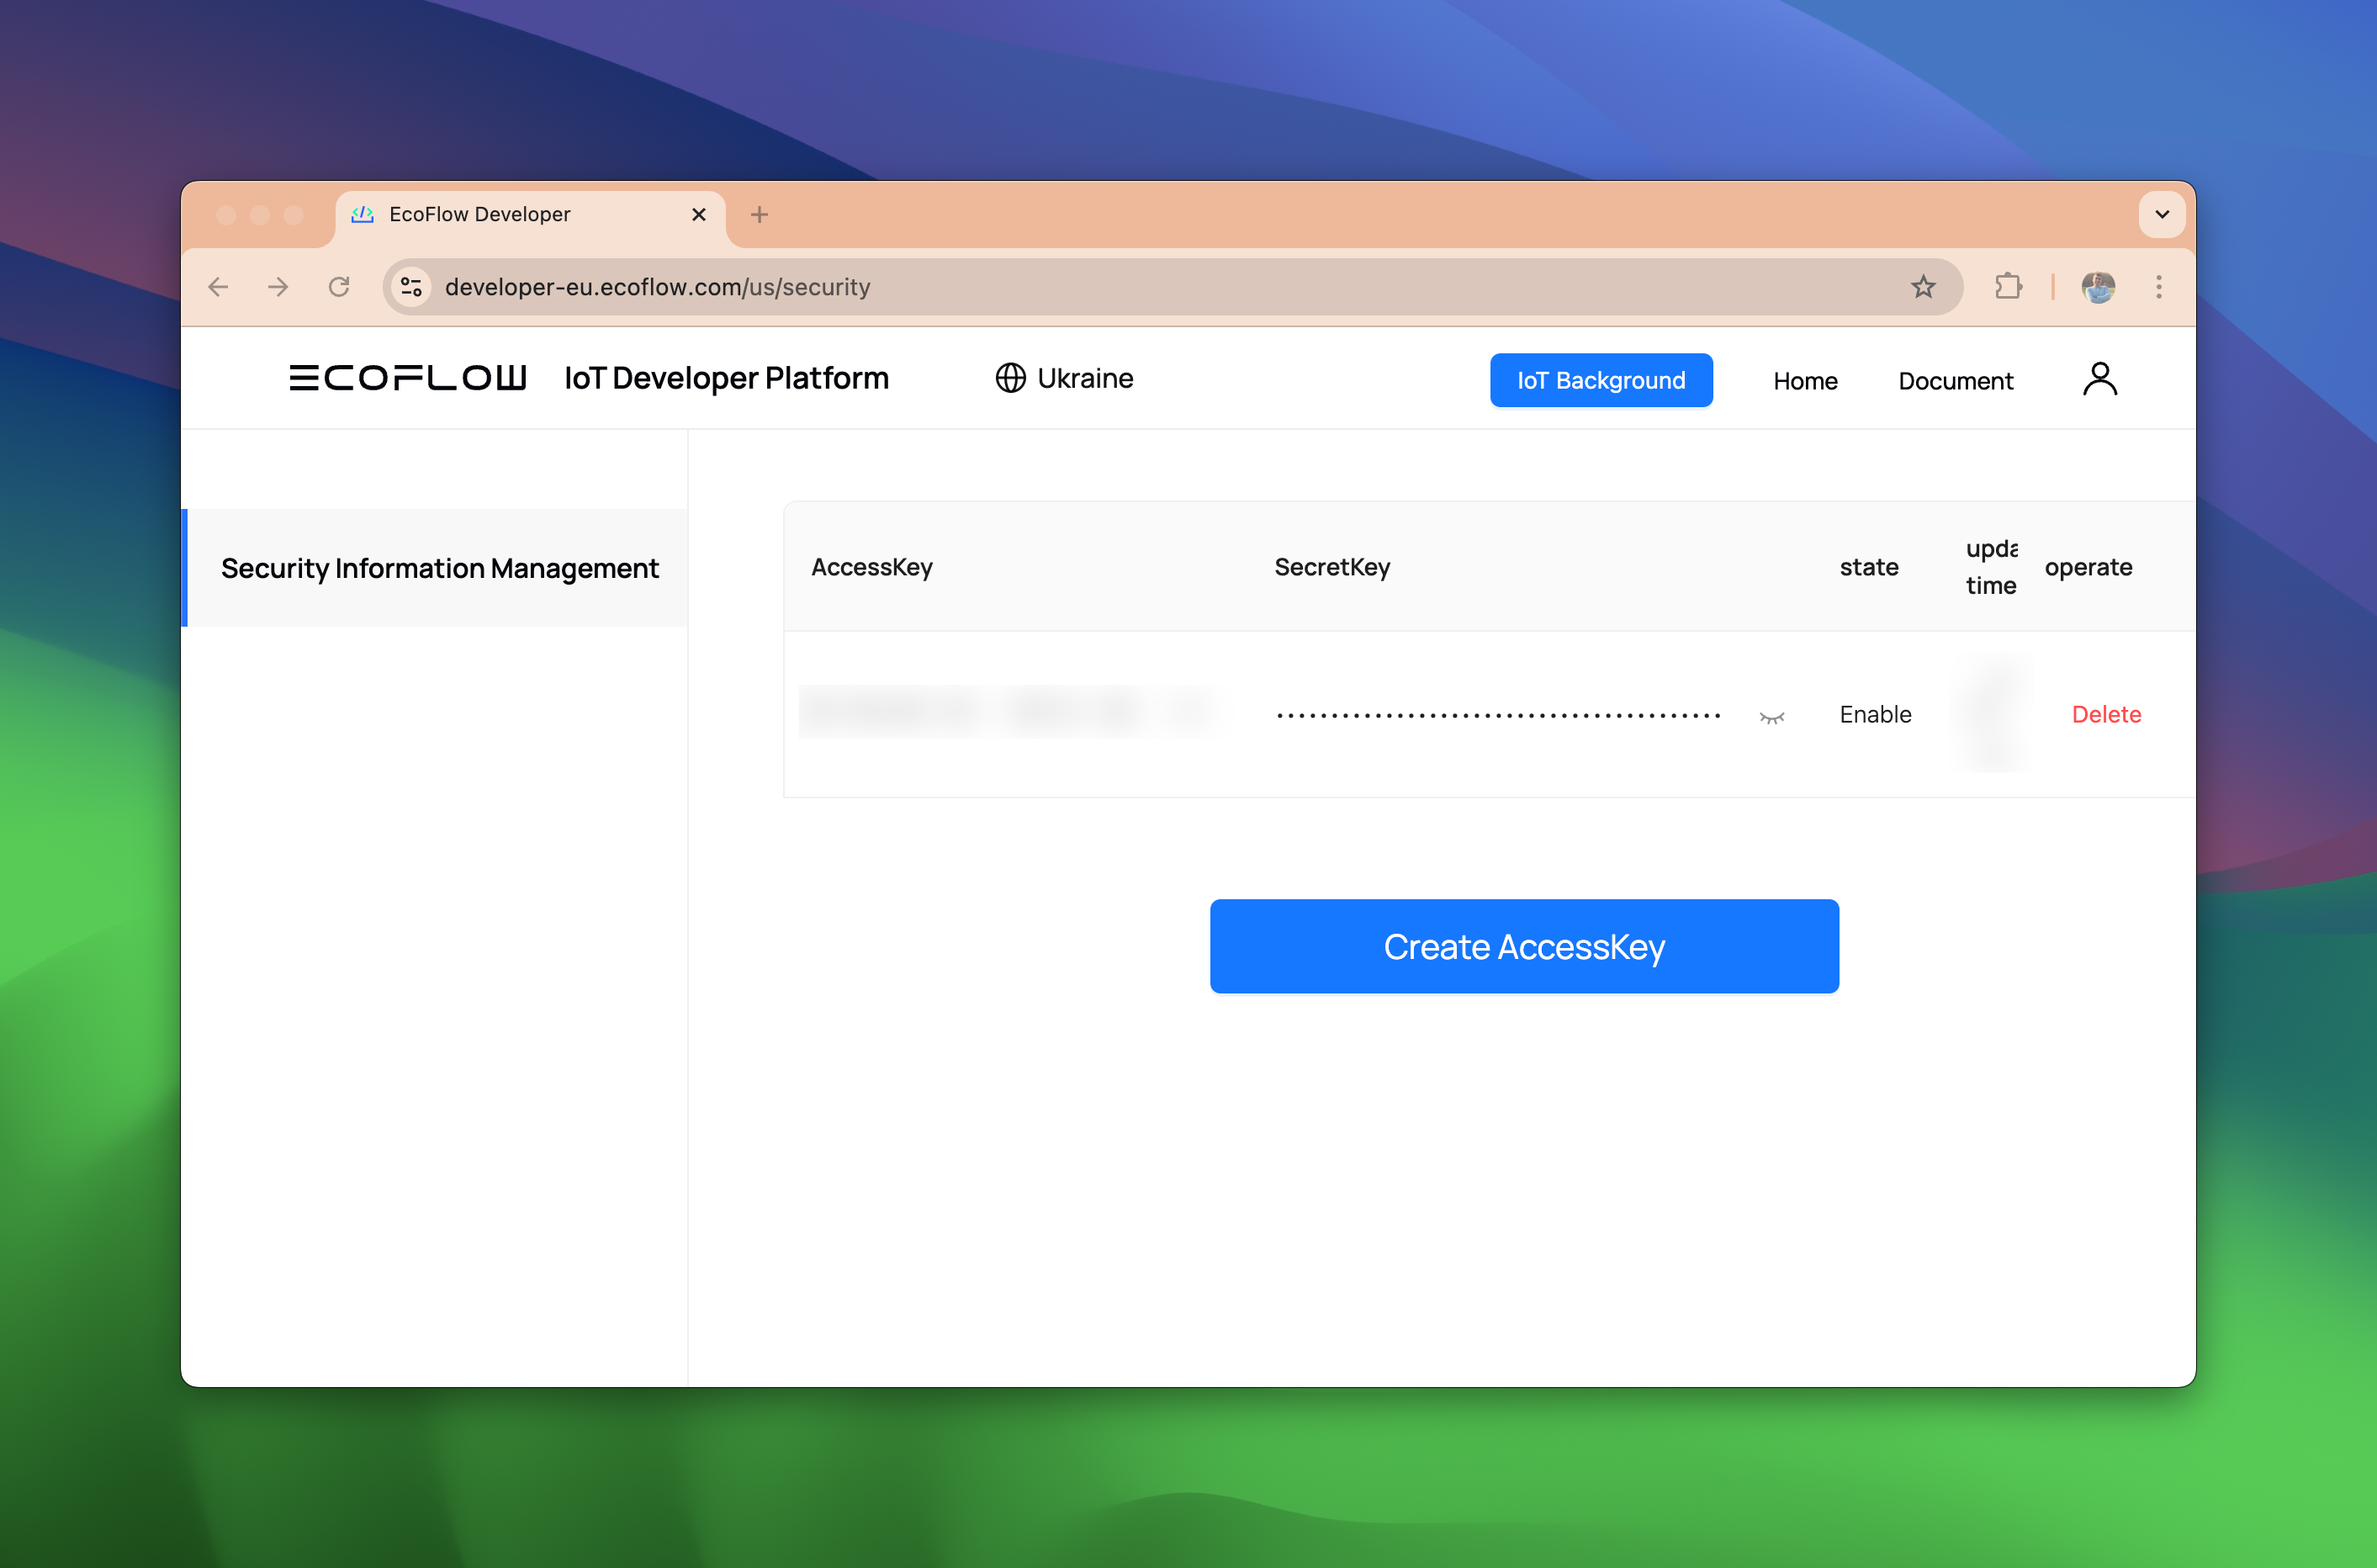
The project took a leap forward when I obtained EcoFlow API keys, opening up new possibilities for integration. Here’s what you need to know:
- Obtaining a developer account from EcoFlow’s website is necessary to work with their public API. This process can take up to five business days.
- Once approved, you’ll receive an access key and a secret that grant you access to the public API.
With API access secured, I began exploring existing integrations of EcoFlow with Prometheus. I discovered the ecoflow_exporter repository, which aligned with my goals but had some limitations:
- It didn’t use the public API, instead impersonating a mobile app client.
- This integration method proved unreliable, disconnecting after a few successful metric retrievals if the mobile app wasn’t actively used.
Despite these drawbacks, it provided a solid starting point. I found a comment from a contributor who had rewritten the scraper to use the public API, which led me to create my own version that leverages the public MQTT API.
Enter Grafana and Prometheus
This project presented the perfect opportunity to dive deeper into Grafana and Prometheus, tools I had previously underutilized in my homelab. For those less familiar:
- Prometheus is an open-source monitoring and alerting toolkit that collects and stores metrics as time-series data.
- Grafana is a multi-platform open-source analytics and visualization web application that connects with various data sources, including Prometheus.
Together, they form a powerful, flexible, and open-source monitoring solution that’s perfect for homelab projects.
MQTT: Real-Time Communication for IoT
This project marked my first encounter with MQTT (Message Queuing Telemetry Transport). Here are some key points about this protocol:
- It’s a lightweight, publish-subscribe network protocol designed for efficient IoT communication.
- MQTT is ideal for scenarios with limited network bandwidth or unreliable connections.
- It follows a publish/subscribe model, using a broker to manage message distribution.
In our EcoFlow integration, MQTT enables real-time updates on battery status and power metrics, offering more timely and efficient data collection compared to periodic API polling.
sequenceDiagram
    participant Client as MQTT Client
    participant Broker as MQTT Broker
    participant Server as Authentication Server

    Note over Client, Server: Step 1: Authentication
    Client ->> Server: Request authentication with credentials
    Server -->> Client: Return authentication token and MQTT broker address

    Note over Client, Broker: Step 2: Establish Connection
    Client ->> Broker: Connect using authentication token
    Broker -->> Client: Connection established

    Note over Client, Broker: Step 3: Subscribe to Topic
    Client ->> Broker: Subscribe to topic (e.g., /sensor/data)
    Broker -->> Client: Subscription acknowledged

    Note over Client, Broker: Step 4: Publish to Topic
    Client ->> Broker: Publish message to topic (e.g., /sensor/data)
    Broker -->> Client: Publish acknowledged

    Note over Client, Broker: Step 5: Receive Messages
    Broker -->> Client: Forward messages from subscribed topics
Prometheus Exporter
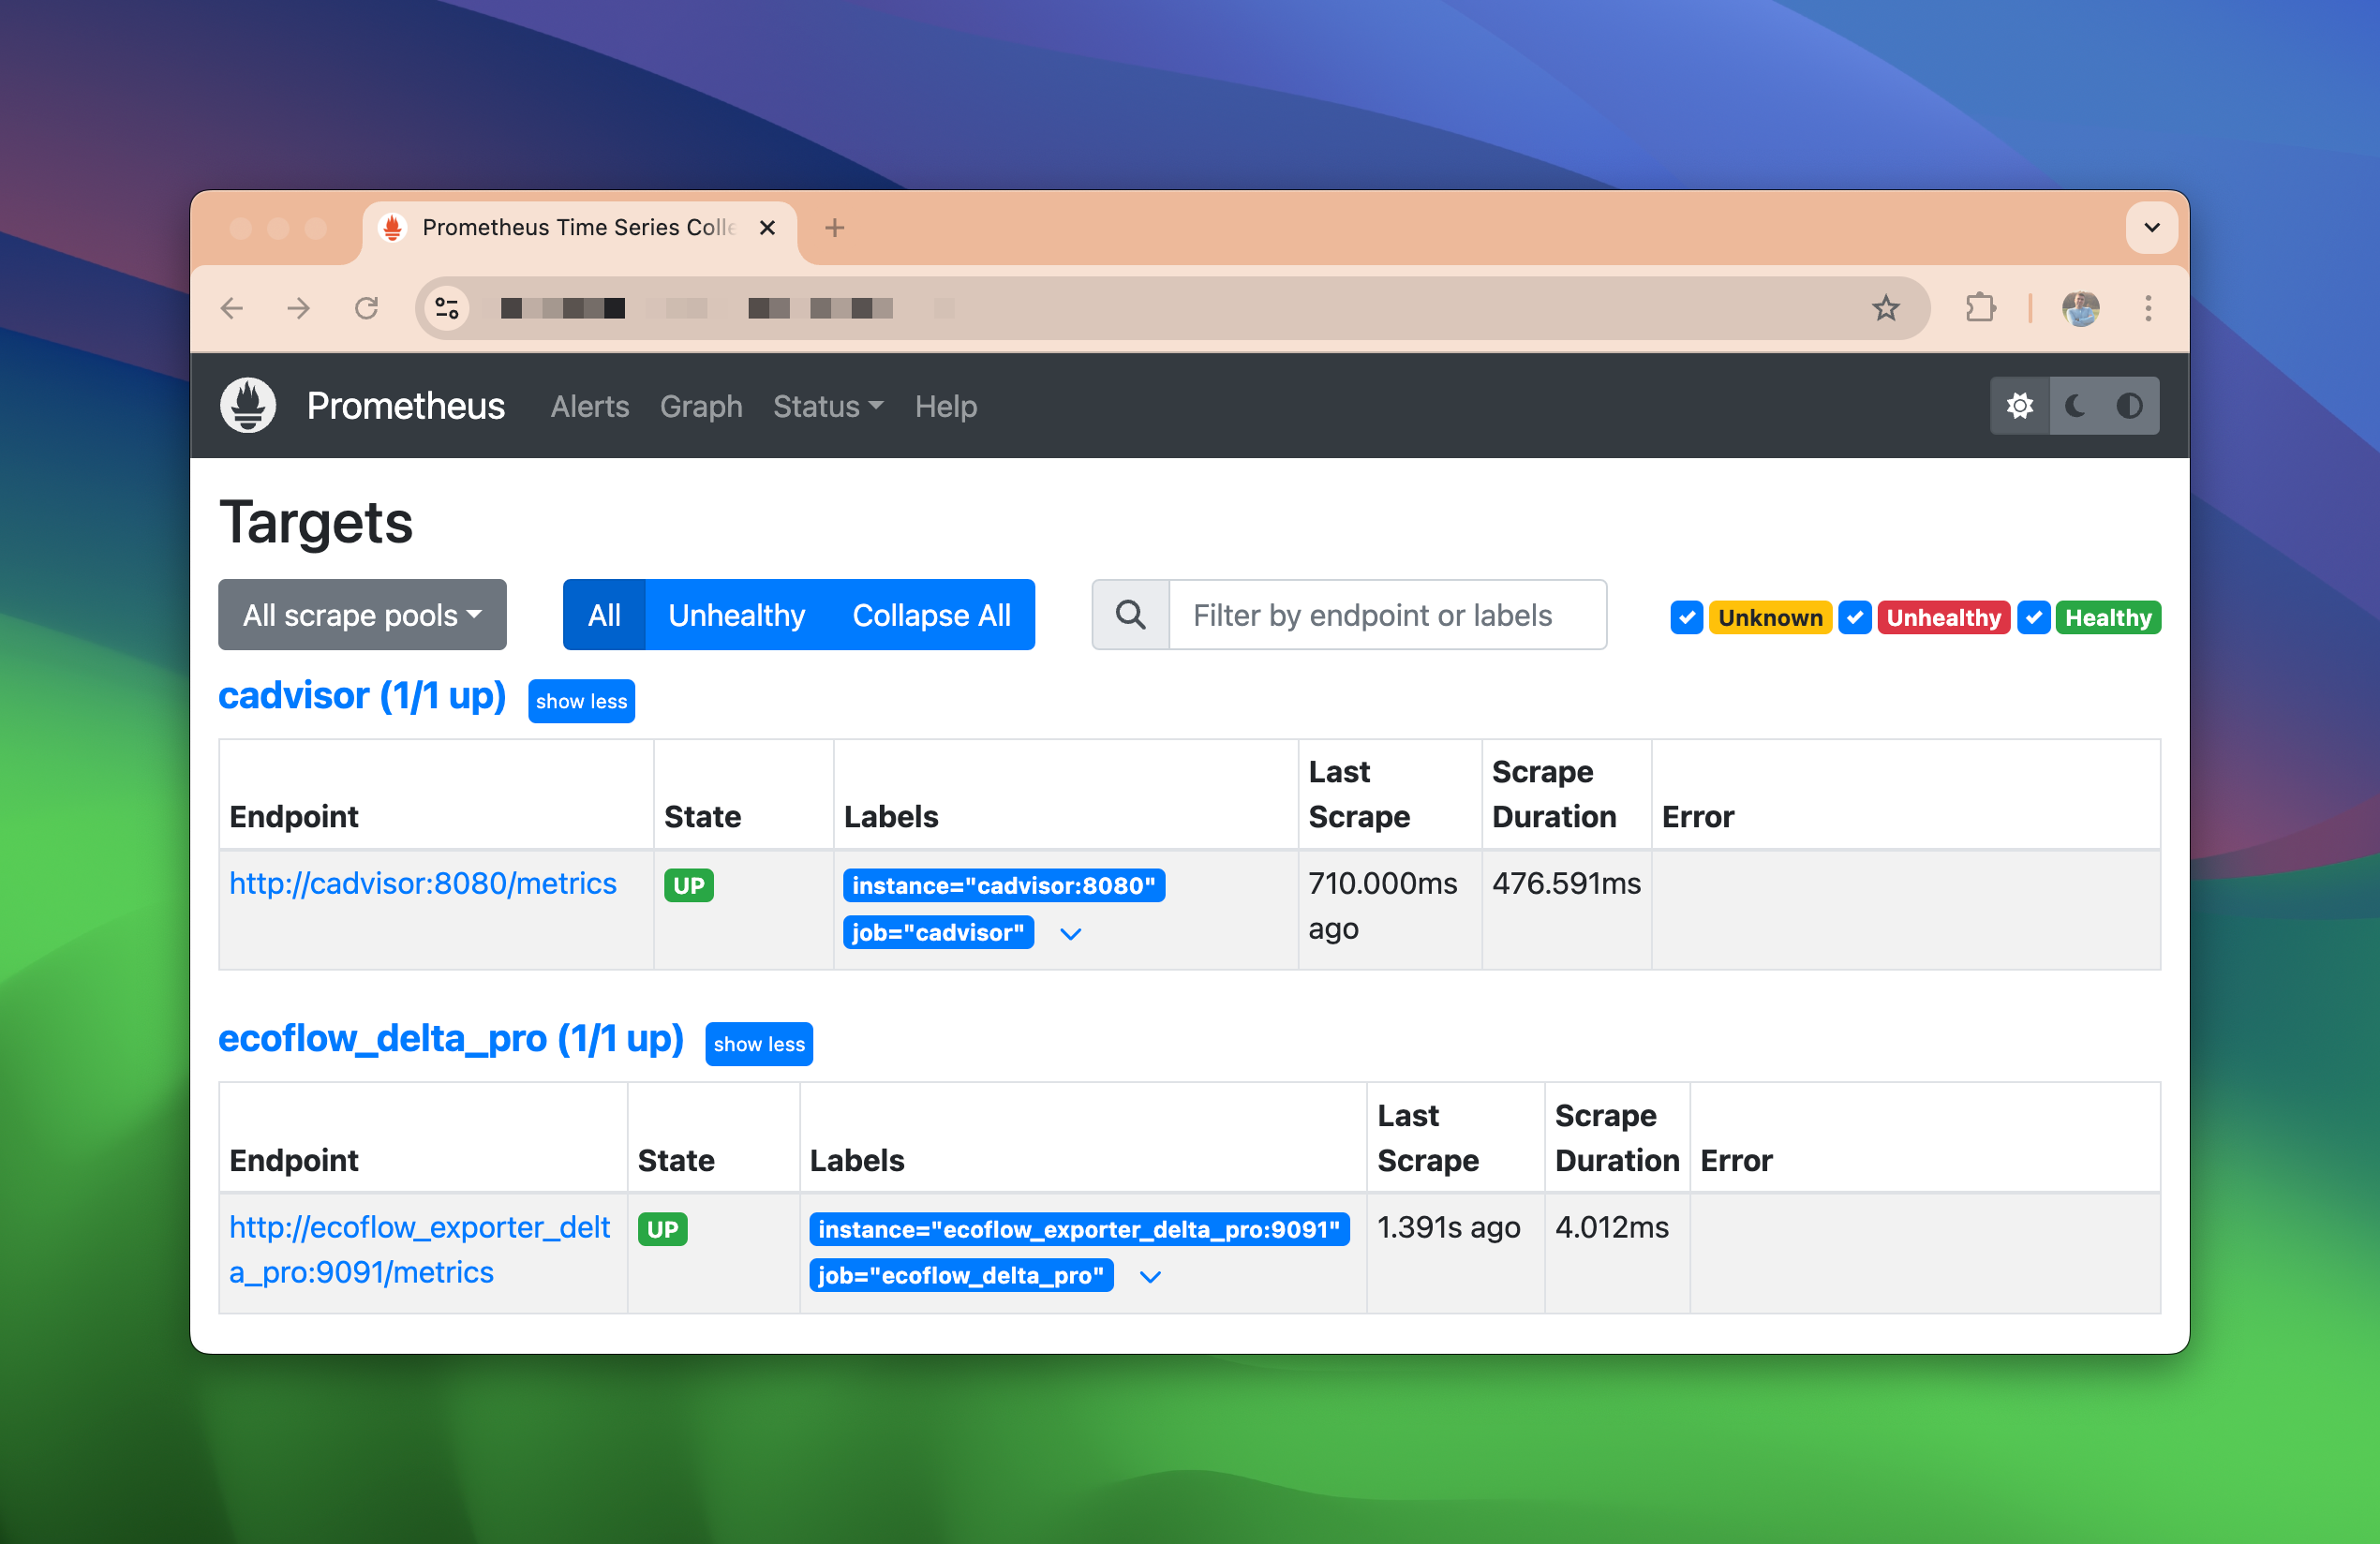
To address the ongoing issues with the existing library, I forked the original repository and created my own Prometheus exporter that leverages the public MQTT API: ⚡ EcoFlow to Prometheus Exporter (Public API Version).
This exporter acts as a bridge between the EcoFlow MQTT messages and Prometheus, translating the data into a format Prometheus can scrape. For those interested in exploring other exporters, check out the official Prometheus exporters list.
System Characteristics and Trade-offs
Our new setup represents a significant shift from the previous ping-based system, introducing both advantages and potential challenges:
-
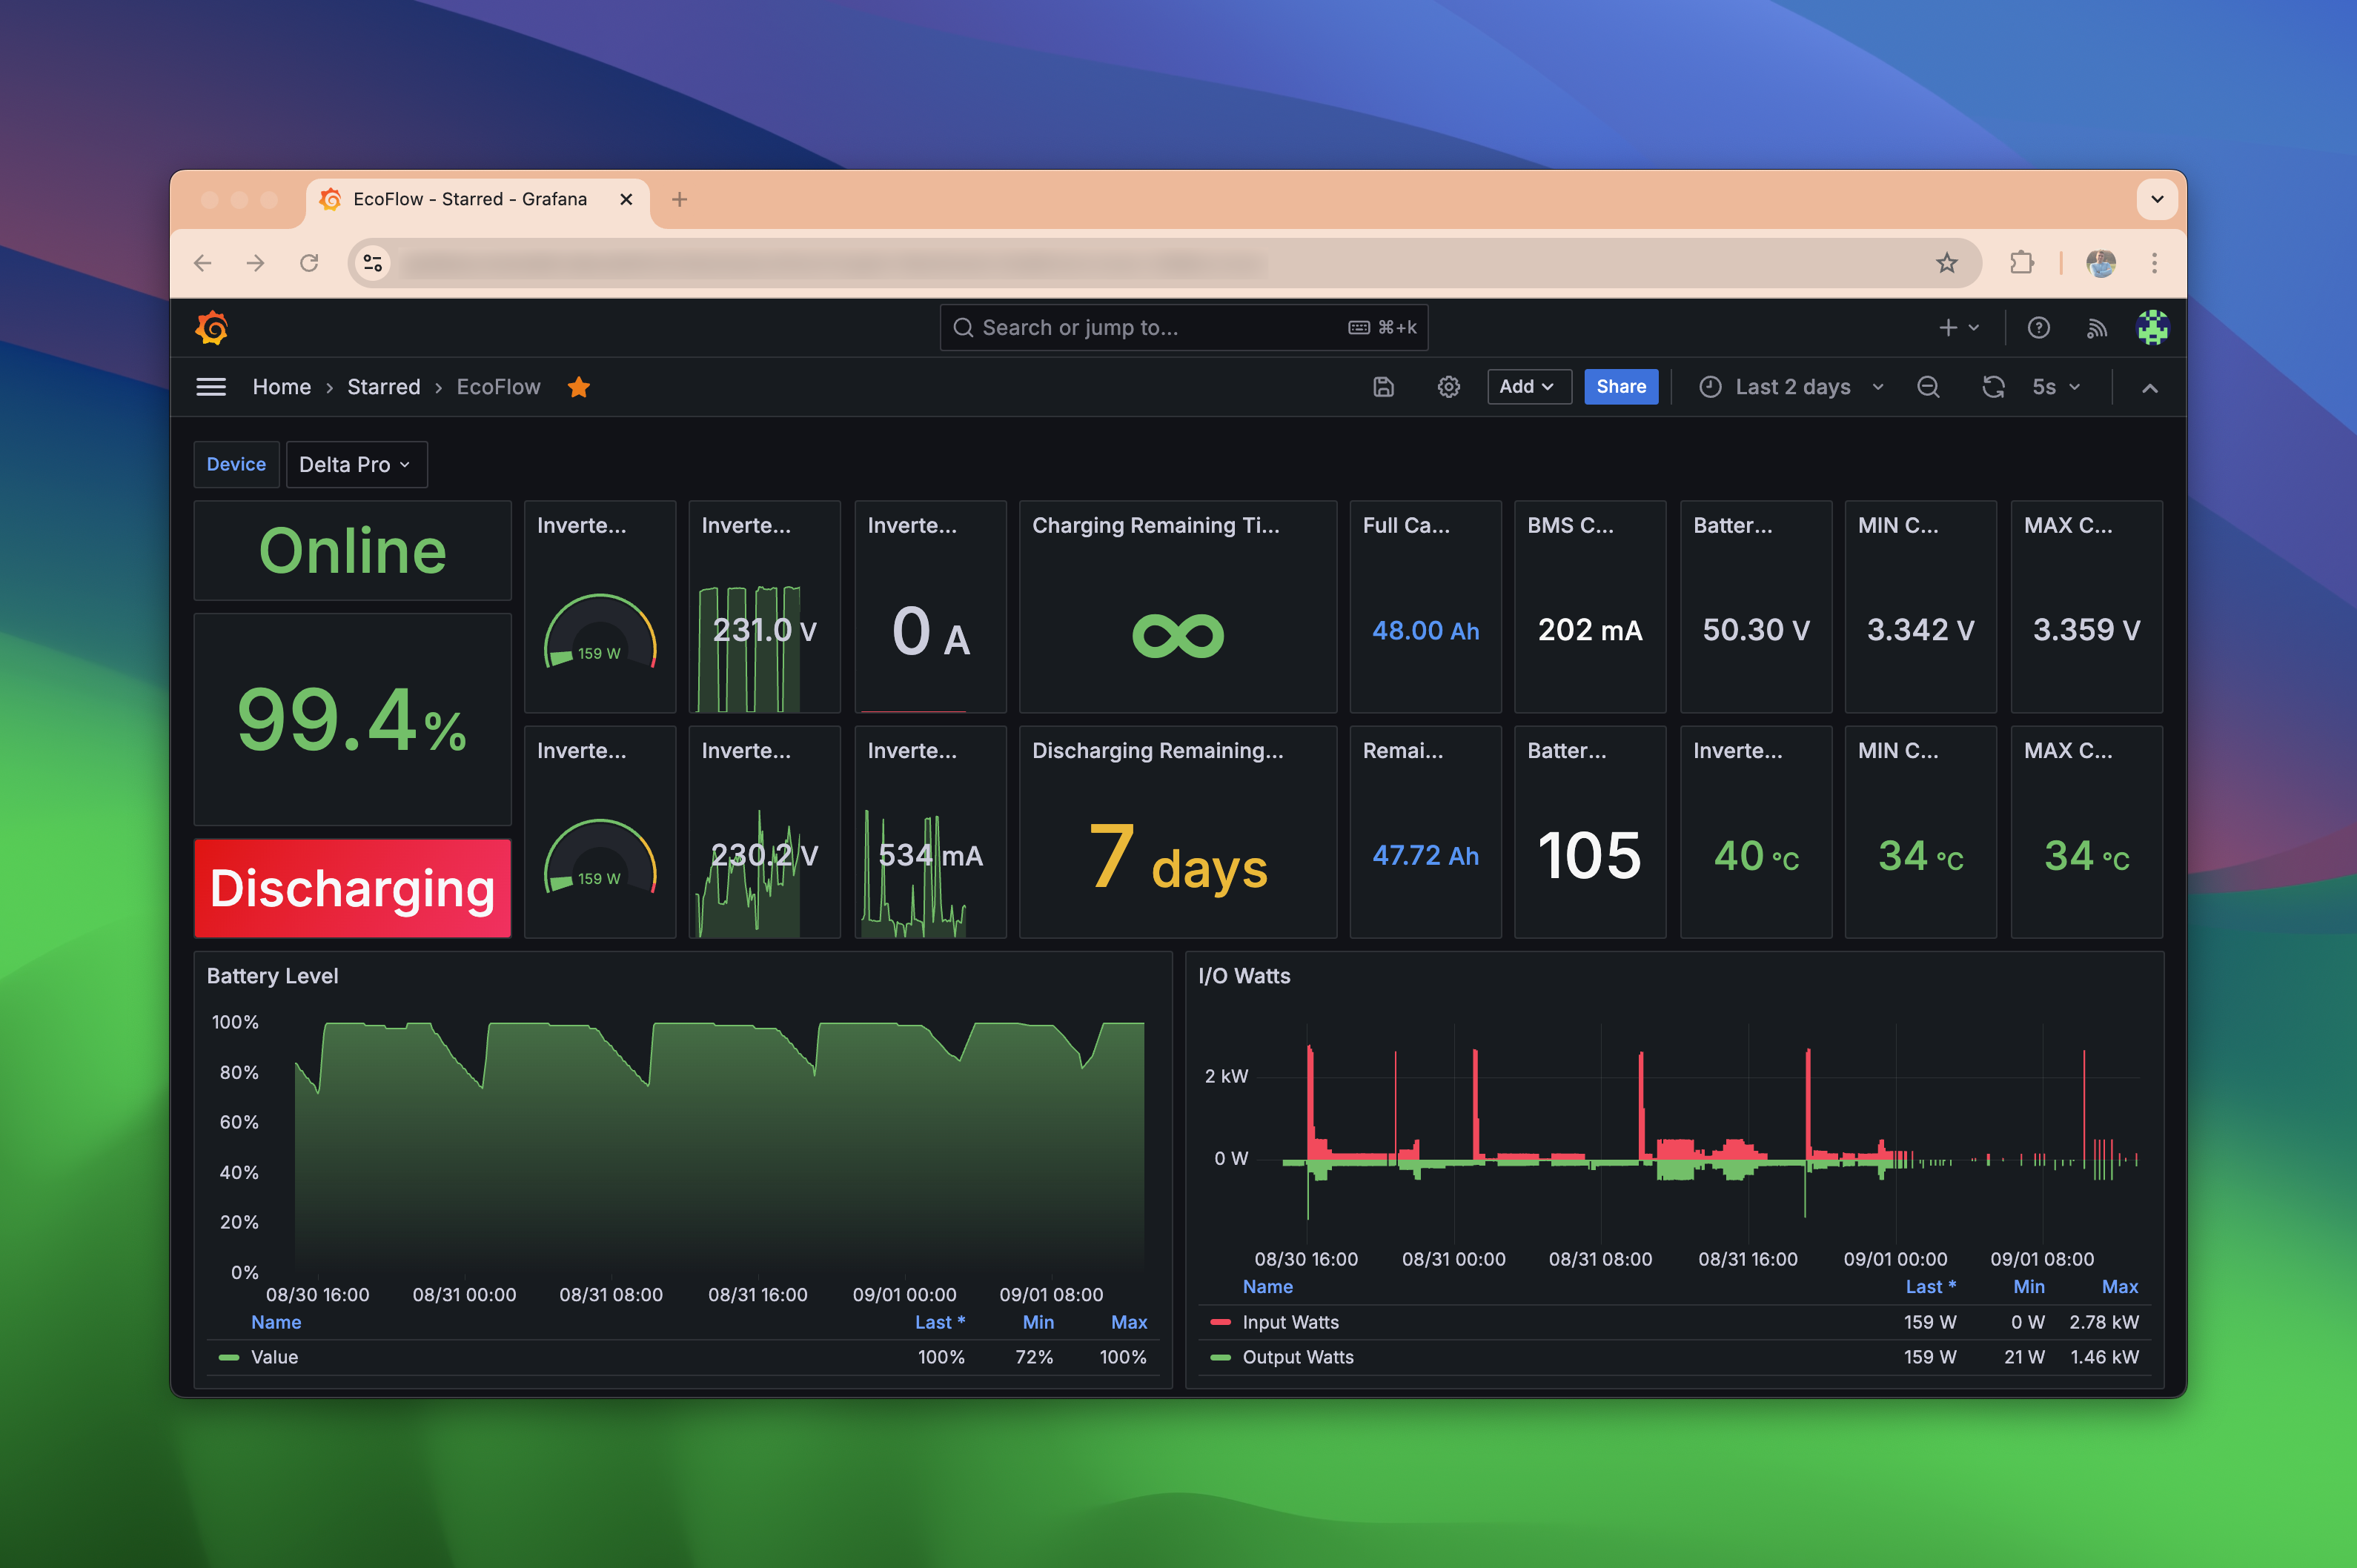
Data Richness: We now collect over 50 different metrics from the EcoFlow device, providing a much more comprehensive view of our power system.
-
Real-time Updates: The MQTT-based approach allows for event-driven updates, potentially offering more timely information compared to periodic polling.
-
Scalability: The architecture is designed to accommodate multiple devices, allowing for future expansion if needed.
-
Complexity: With increased capabilities comes increased complexity. The system now involves multiple components (MQTT, Prometheus, Grafana) that need to work in concert.
-
Resource Requirements: This more sophisticated setup demands more computational resources and network bandwidth compared to the simple ping-based approach.
-
Reliability Considerations: While we’ve implemented automatic reconnection logic and error handling, the increased number of components also introduces more potential points of failure.
-
Observability: The wealth of data now available allows for more detailed analysis and troubleshooting, but also requires more effort to manage and interpret effectively.
It’s important to note that the true impact of these changes on overall system performance and reliability will only become clear after extended observation and use. We’ll need to monitor the system closely over time to fully understand its characteristics and optimize its operation.
Alerting: Keeping Everyone Informed
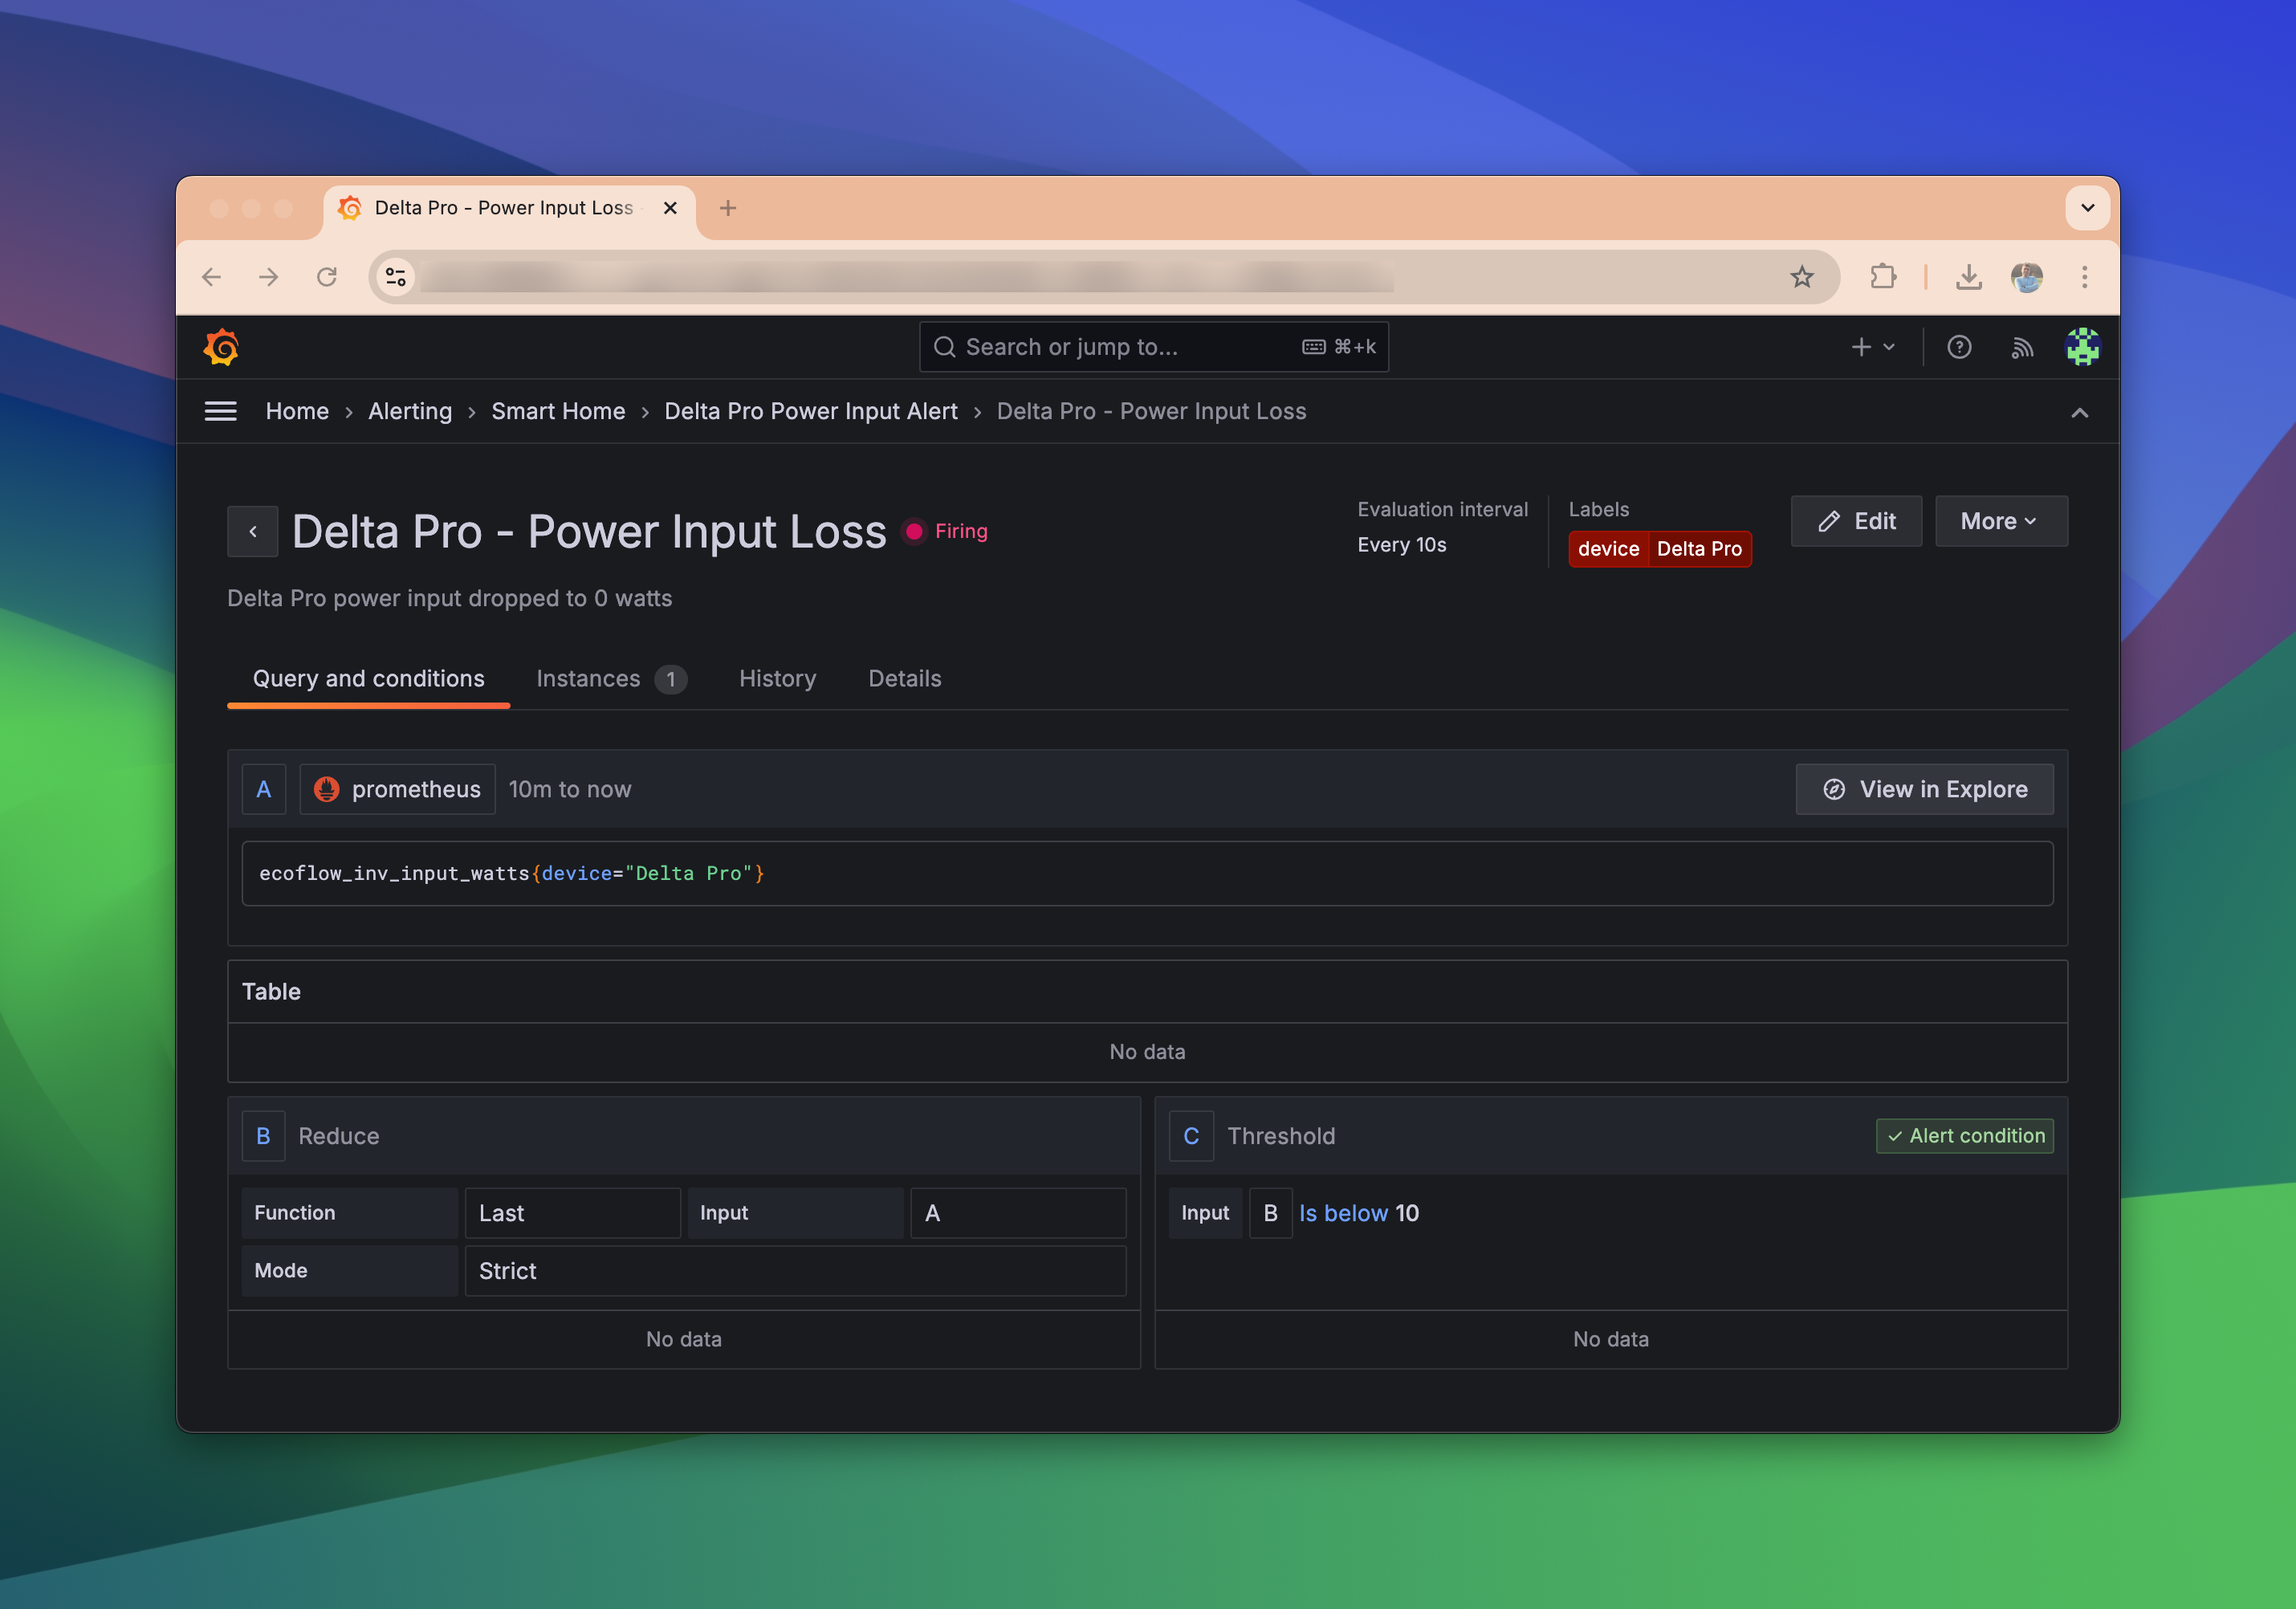
To ensure immediate awareness of power issues, I configured a Grafana alert based on input wattage. If the system detects no input power, it triggers an alert.
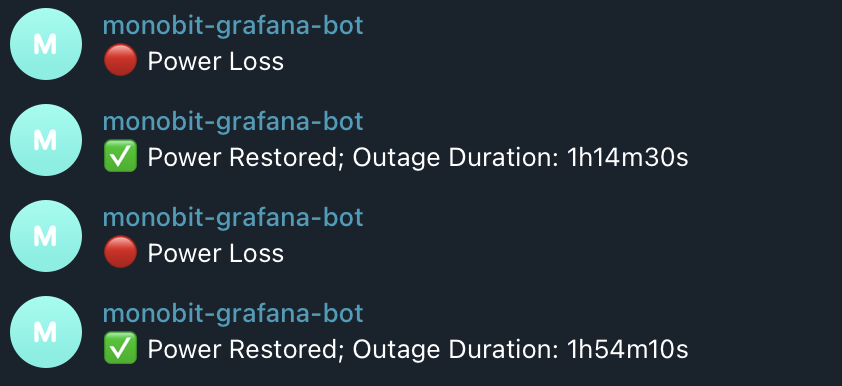
For notifications, I used Telegram, though Grafana supports a variety of channels. While the configuration process is straightforward, I spent some time refining the notification template. The Go templating system used by Grafana for notifications requires some learning. Investing about 30 minutes to go through some useful tips and documentation is highly recommended.
Here’s the alert template I’m using:
{{ if gt (len .Alerts) 0 }}
  {{ range .Alerts }}
    {{ if eq .Status "firing" }}
      🔴 Power Loss
    {{ else }}
      ✅ Power Restored; Outage Duration: {{(.EndsAt.Sub .StartsAt).Truncate 1000000000}}
    {{ end }}
  {{ end }}
{{ else }}
  ⚠️ No Data: Unable to determine power status
{{ end }}
This template provides clear and concise alerts for power loss events and their duration.
Results and Lessons Learned
The new system offers several advantages:
- Detailed Insights: Enhanced visibility into power consumption and battery status.
- Real-Time Updates: Potentially quicker responses to changes via MQTT updates.
- Customizable Dashboards: Grafana allows for effective visualization of trends and patterns.
- Scalability: The system can monitor multiple EcoFlow devices. (Currently, I track two devices but use only one for alerting.)
This project has not only improved our power monitoring capabilities but also provided valuable learning experiences with MQTT, and reinforced my skills with Grafana and Prometheus. Moving forward, I plan to leverage Prometheus and Grafana for other projects, and I’m already exploring Loki to enhance my homelab monitoring with log tracking. I’m excited about the potential this new setup offers and am considering expanding the system to monitor other aspects of our home environment, such as temperature and humidity, leveraging the scalability of our Grafana/Prometheus stack.
I hope this deep dive into my power monitoring project has been informative and perhaps even inspiring for your own homelab adventures. Remember, every project, no matter how small, is an opportunity to learn and grow. Happy monitoring!
Additional Materials
- go-ecoflow-exporter - An alternative EcoFlow metric exporter written in Go.
- EcoFlow: Monitoring with Prometheus and Grafana - This article provides more detailed configuration steps. If you want to replicate the setup, check out this post.
- EcoFlow Reddit community